Wi-Fi channels

A big premise
This article is a mix of what I’ve learned in the past few years and more recent studies on the RF physical layer which forced me to investigate in depth concepts like: encoding, spectral mask, Clear Channel Assessment or the Shannon limit. Stuff that you don’t have to know perfectly if you’re trying to achieve a mixed-work career oriented more towards R&S than wireless technologies and I probably won’t study them deeply myself. But I’m very curious and I find it interesting knowing how things work from the bottom up. So that’s it 😄
The external references I’ve used are in the bottom of the page. Links to the single paragraphs are in the table of contents. Finally this article by Amazon wireless engineer Jeremy Sharp and the agnostic book “802.11 Wireless Networks” by Matthew S. Gast were both a huge inspiration while writing all this crap down. Go read it both!
What is a wireless channel?
Before addressing the individual topics, here is the definition of a wireless channel based on what I’ve learned so far:
a channel is a numbered, shared, layer 1 domain with a specific bandwidth (often expressed in MHz) and a center frequency.
Let’s unpack the little, over condensed, definition of channel:
- A radio frequency channel is numbered because channel “1” is easier to remember than “22 MHz channel with center frequency of 2412 MHz between 2401 and 2423 MHz”.
- An RF channel is a “shared” medium because, unlike IEEE 802.3 Ethernet, which is shielded from the outside, there is no “shielded twisted pair” over the air, and interferers and ground noise are important variables to consider.
- A RF channel is a layer 1 domain because it sits alongside 802.3 in the bottom of the ISO-OSI pile.
- A Wi-Fi RF channel uses bandwidth of 20 MHz for OFDM-based transmissions and 22 MHz for DSSS-based, but we can bond channel together and double the bandwidth up to 160 MHz. 20, 40, 80 and 160 MHz are the wireless enterprise standards but some technologies can use 1 (like Bluetooth), 5 or 10 MHz bandwidth.
- The center frequency of a RF channel is the peak frequency where most of the information are transmitted.
This definition can surely be expanded according to your background but for a networking engineer with a mixed knowledge of routing, switching and wireless, this is a good starting point because it encapsulates all the core variables.
In the next section I’m going to unpack different concepts:
- The shape of a wireless channel
- Good and bad channel utilization
- Channel bonding
- Channel assignment algorithms: Cisco DCA
Spectral mask or “what the hell am I watching?!?”
The first day I opened Chanalyzer I thought “What the hell am I watching?!” And that is the root question of this paragraph: why do we occasionally see a hill shape, a squared shape, a panettone shape, or neither during an RF analysis?
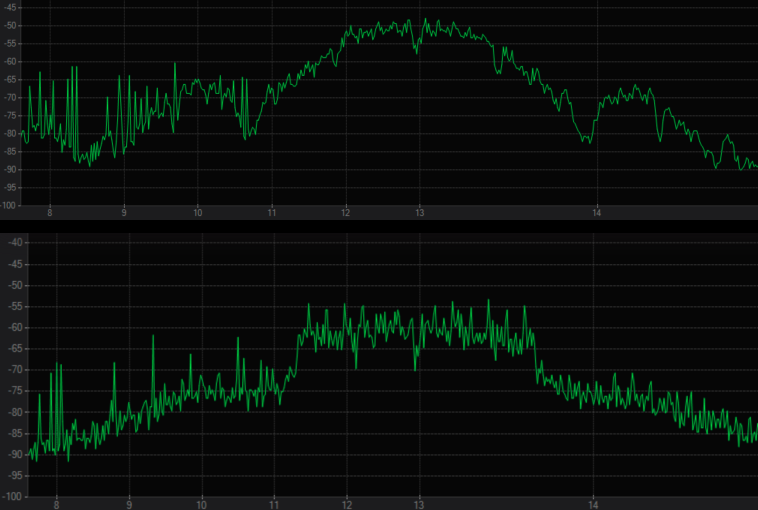

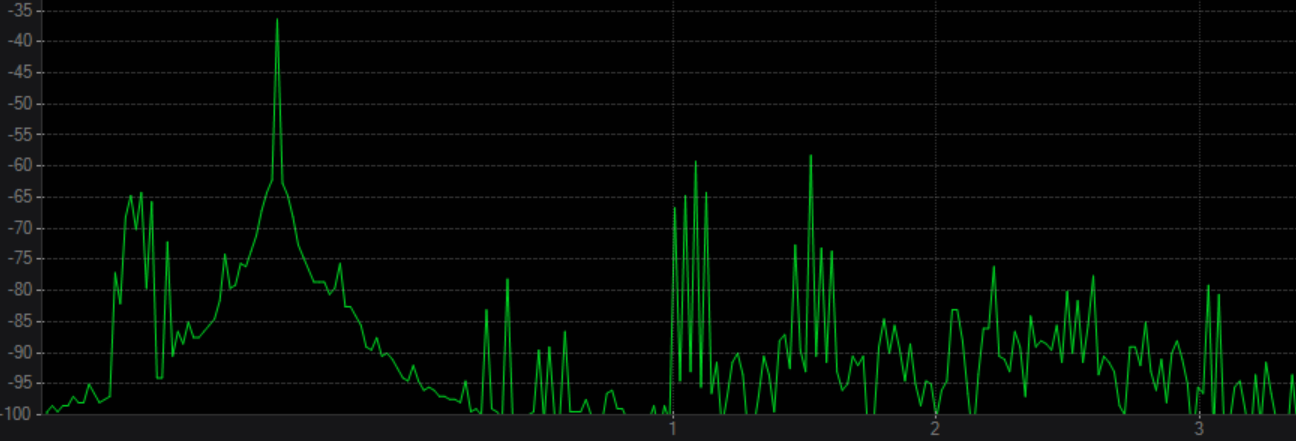
The thing that I’m seeing on the screen during a RF analysis is the live representation of a spectral mask which is a set of rules that confine a transmission to a dedicated slice of the spectrum, preventing leakage of signal on the adjacent channels.
Wikipedia helps us with this definition 1
The spectral mask is generally intended to reduce adjacent-channel interference by limiting excessive radiation at frequencies beyond the necessary bandwidth. Attenuation of these spurious emissions is usually done with a band-pass filter, tuned to allow through the correct center frequency of the carrier wave, as well as all necessary sidebands.
Bits are carried over the air with radio signals using digital encoding schemes which are DSSS and OFDM. Both have different spectral masks:
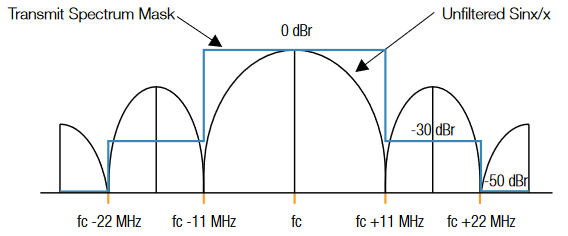
DSSS 2
The spectral mask used for the 802.11b standard. While the energy falls off very quickly from its peak, it is interesting to note the RF energy that is still being radiated at other channels.
OFDM 2
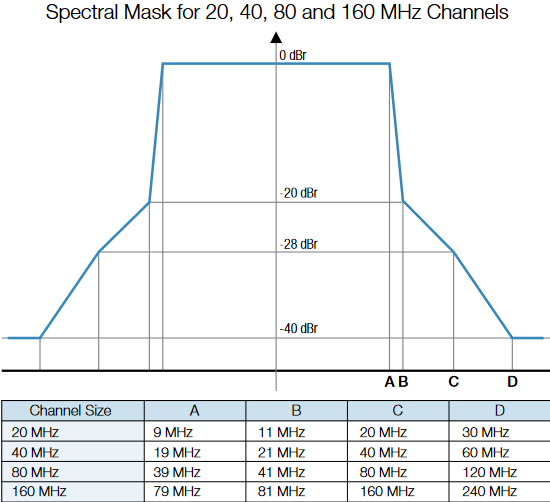
For the 802.11a, 802.11g, 802.11n and 802.11ac standards that are using the OFDM encoding scheme, they have a spectral mask that looks entirely different. OFDM allows for a more dense spectral efficiency, thus it gets higher data throughput than used with the BPSK/QPSK techniques in 802.11b
Everything that does not adhere to these standards causes interference in the wifi spectrum in many cases.The fourth green screenshot is the perfect example which is a volumetric sensor in my house that fortunately works away from traditional channels.
The Good, the Bad and the Ugly utilization of a channel
Channel utilization is a layer one measurement of the percentage of time a 802.11 channel is used above a amplitude threshold, usually of -95 dBm, within a time-span (which is mostly 30 seconds in all the gifs in this article).
Some tech articles write that the definitions of airtime and channel utilization are interchangeable but Joel Crane on 2018 Wi-Fi Trek conference splits those two definitions:
- Channel utilization is a layer 1 measurement of the average percent of utilization across an 802.11 channel. It is measured with a spectrum analyzer.
- Airtime is a layer 2 measurement of time reserved on the air by 802.11 stations. It is measured with a packet analysis of 802.11 frames.
Splitting the definition is ok but at the end these two variables are often very correlated with each other as Joel said.
The tricky thing about this percentage value is that the same amount of throughput can occupy the RF medium with different percentages because lower speed modulation packs fewer bits than higher speed modulation into a given time interval. So a 10 Mbps throughput requires different channel utilization depending on the capabilities of a wireless client. 3
“But I can use 40, 80 or even 160 MHz channels to speed things up, right?” Increasing a channel’s bandwidth may improve channel utilization, but be careful not to fall into the trap of co-channel interference, which may actually increase channel utilization.
So, when is high utilization a sign of link congestion and when is it a sign of a channel being used efficiently? Ben Miller tries to give an explanation during the WLPC of 2019 4 using this table:
| The Good 🟢 | The Bad 🔴 |
|---|---|
| High rate frames so less channel time used for data | Low rate frames so more channel time used for data |
| Successful frames so the channel is used for data | Unsuccessful frames so the channel is wasted |
Wrapping up, what can cause bad utilization of a channel?
- A very high number of clients, regardless of the protocol used, will always downgrade their data rates with the increasing number of stations under an access point. This effect is 10x more impacful with older protocols in the 2.4 GHz spectrum.
- Low SNR caused by
- Interferences both over and above the CCA threshold (Clear Channel Assessment for energy detection, signal detection and network allocation vector). The first will generate a rising number collisions, the second will in fact raise the noise floor. 5
- “Friendly fire” interferences caused by excessive use of high transmit power, a poor channel plan or a not optimal location of access point.
- Wi-Fi rogue interferences like access point in near buildings of your campus.
- Interferences from non-Wi-Fi devices transmitting in the same spectrum as Wi-Fi.
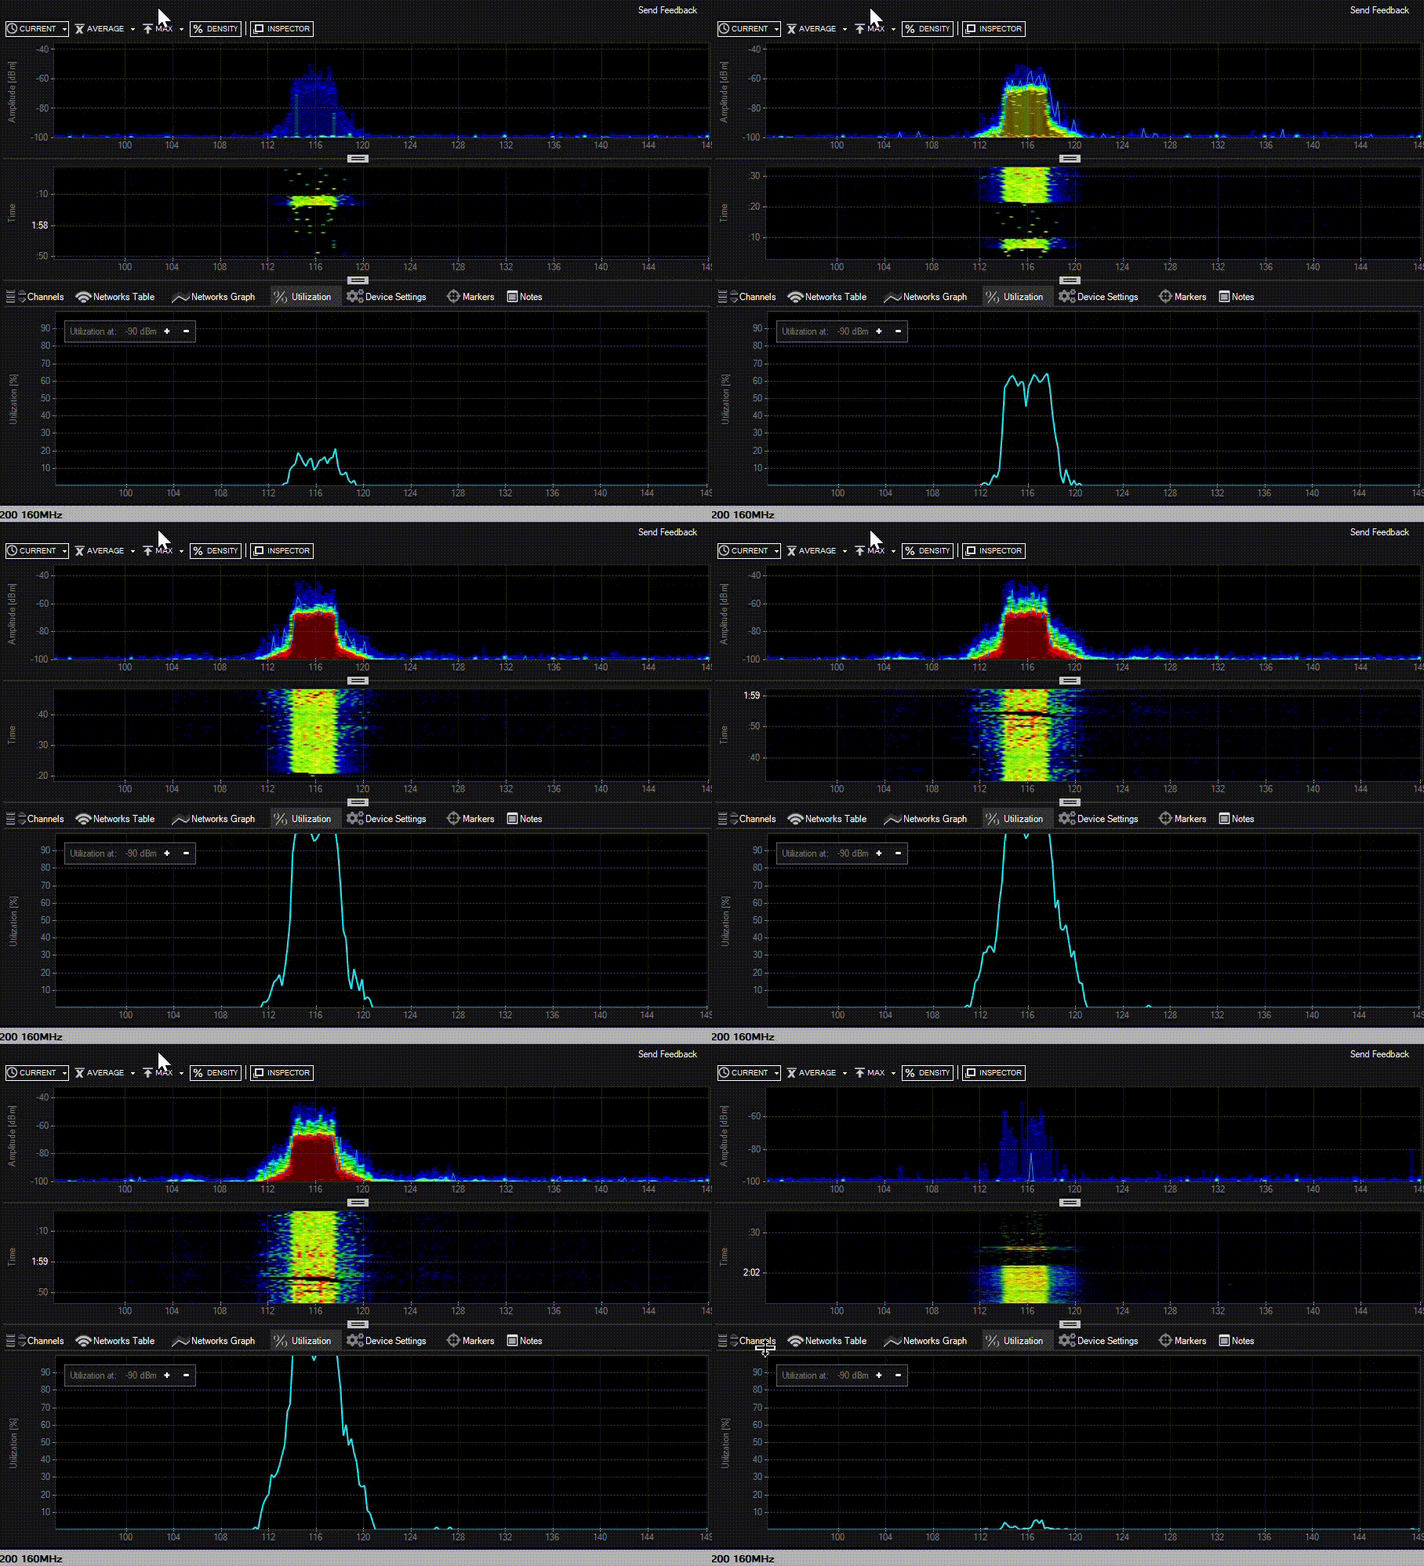
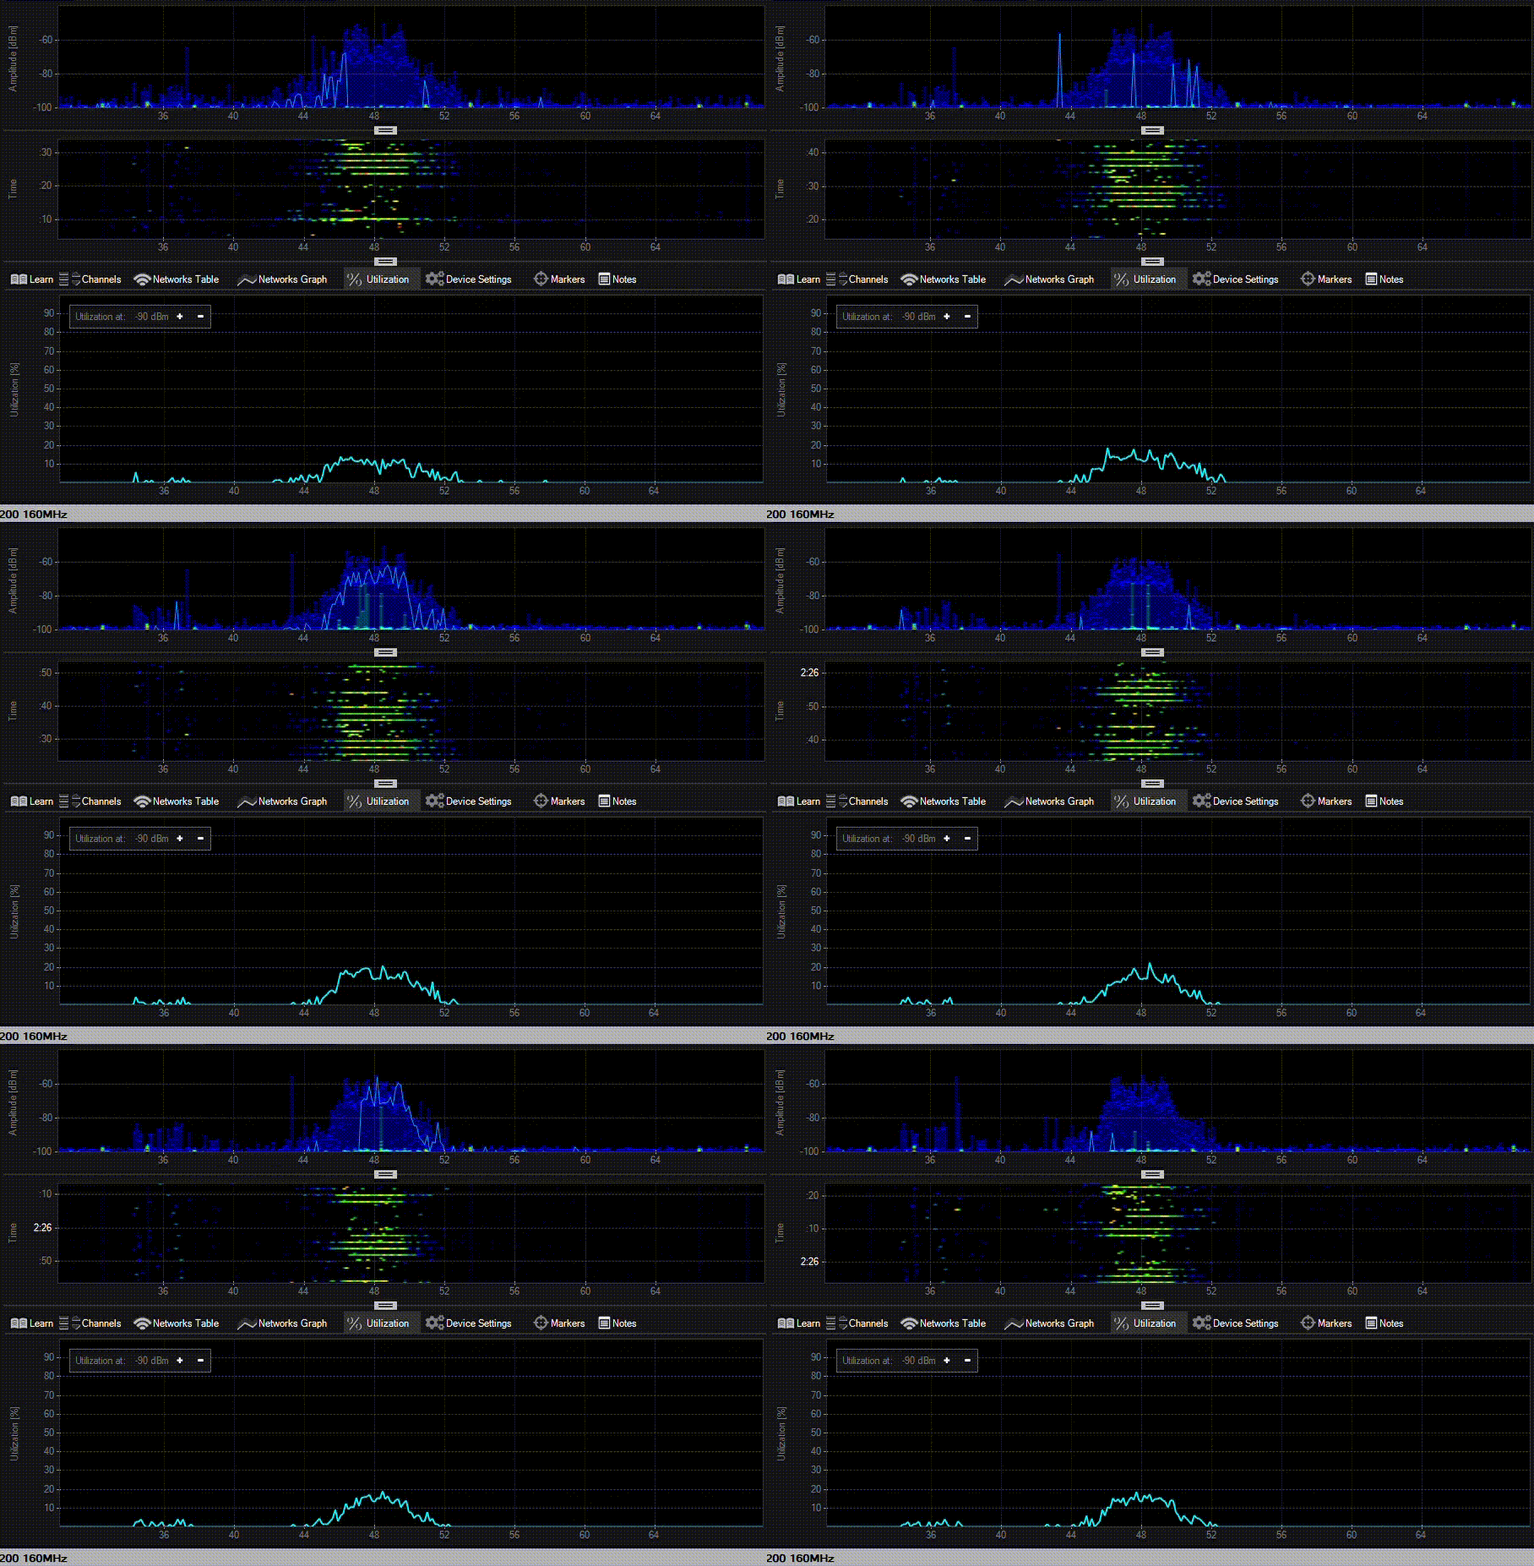
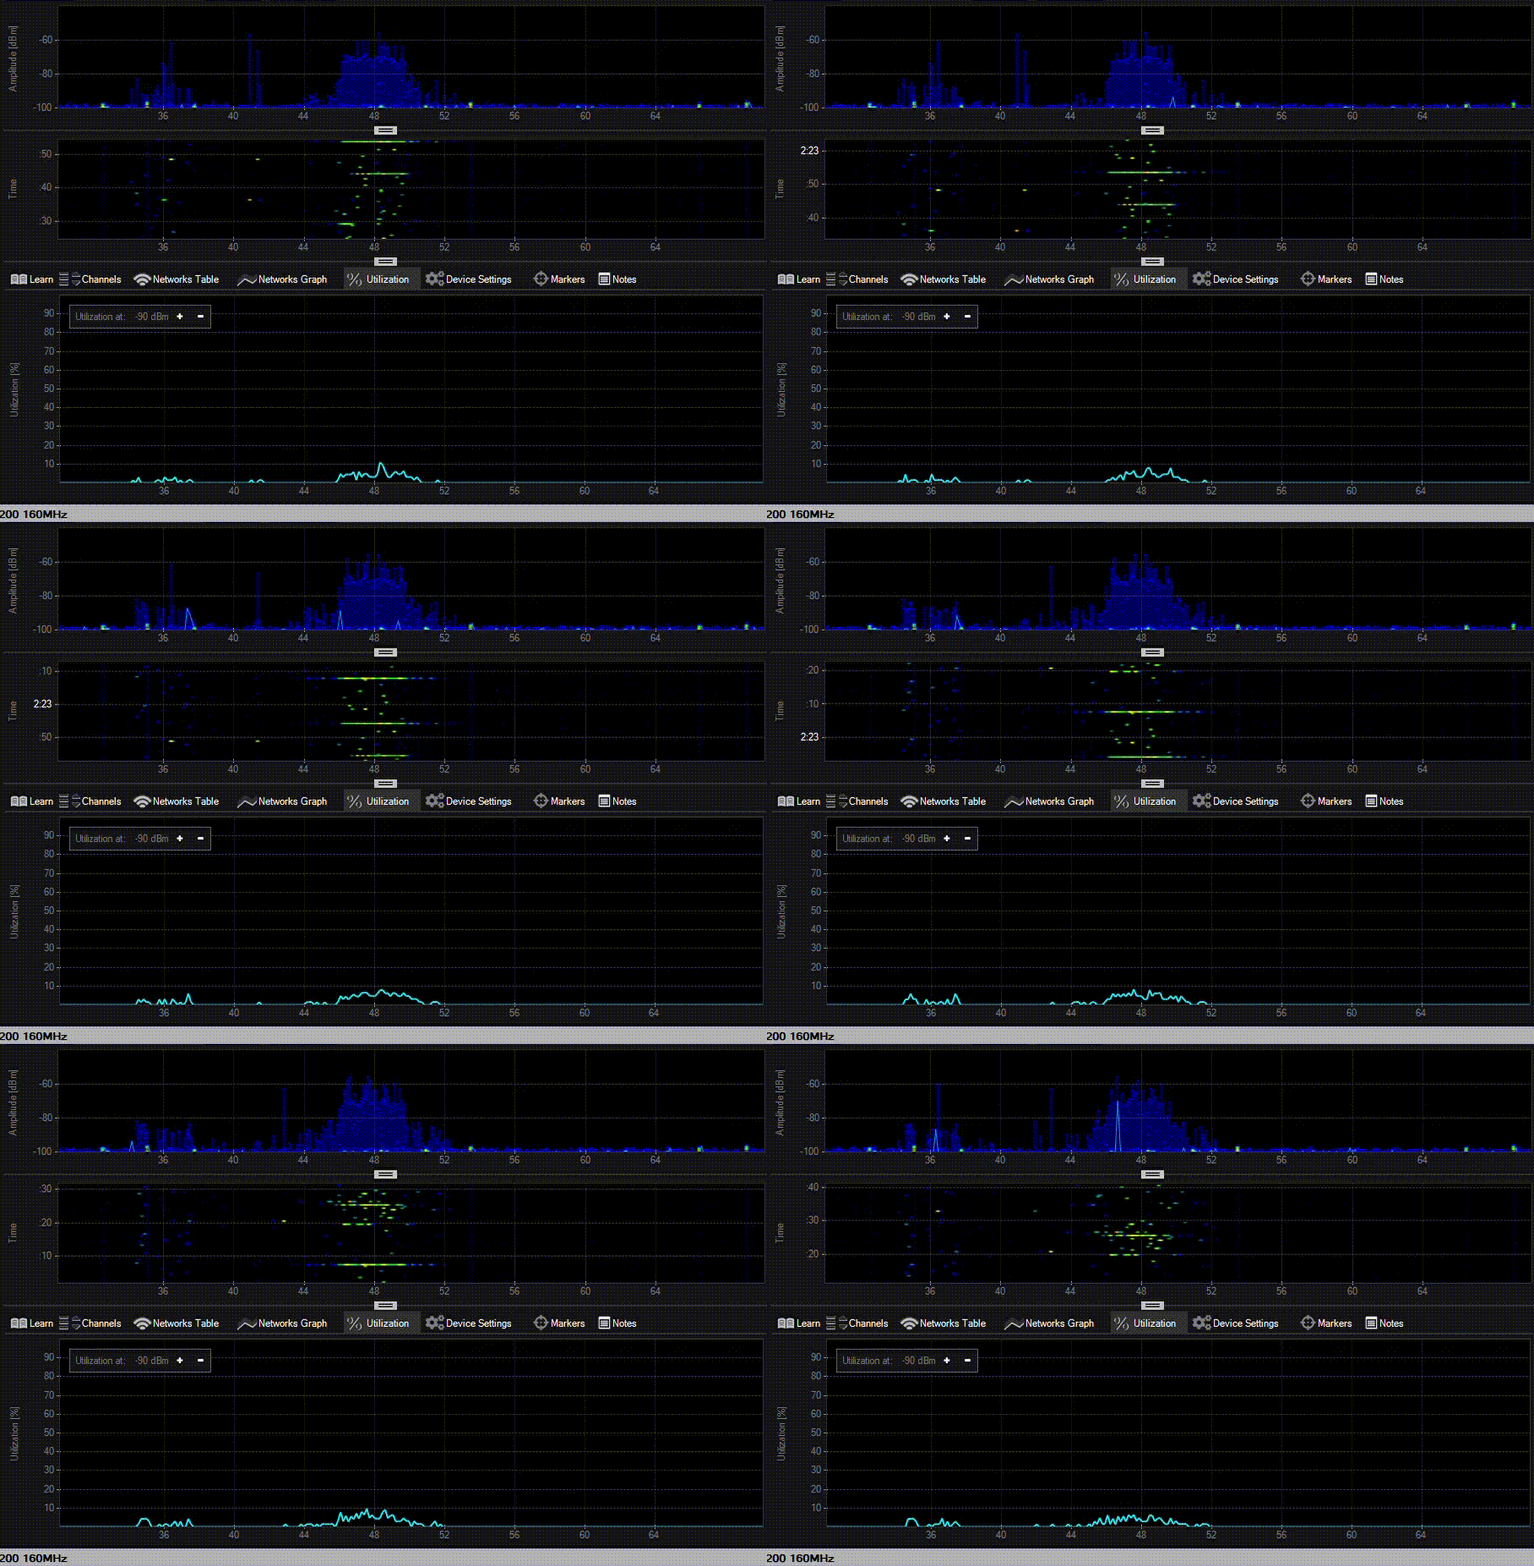
In the previous paragraph we saw how a spectral mask changed shape according to the encoding protocol. So to better visualize and understand both channel utilization and the spectral mask, I made 4 RF captures using Metageek’s Chanalyzer of:
- A file transfer using 802.11ac and channel 116
- A file transfer using 802.11n and channel 13
- A streaming service data flow using 802.11ac and channel 116
- A buffered audio/video streaming service data flow using 802.11ac and channel 116
In the first capture of the file transfer test we can see:
- the utilization threshold set at -90 dBm
- the light blue utilization graph rising from 20 to 100% on the bottom of the screen
- the color of the waterfall graph changing from blue (not busy) to green, then red (fully occupied).
- ignore my mouse hovering on things 👽
I tested the same file transfer on The Ugly 💀 super chaotic 2.4 GHz spectrum in my home (802.11n, channel 13):
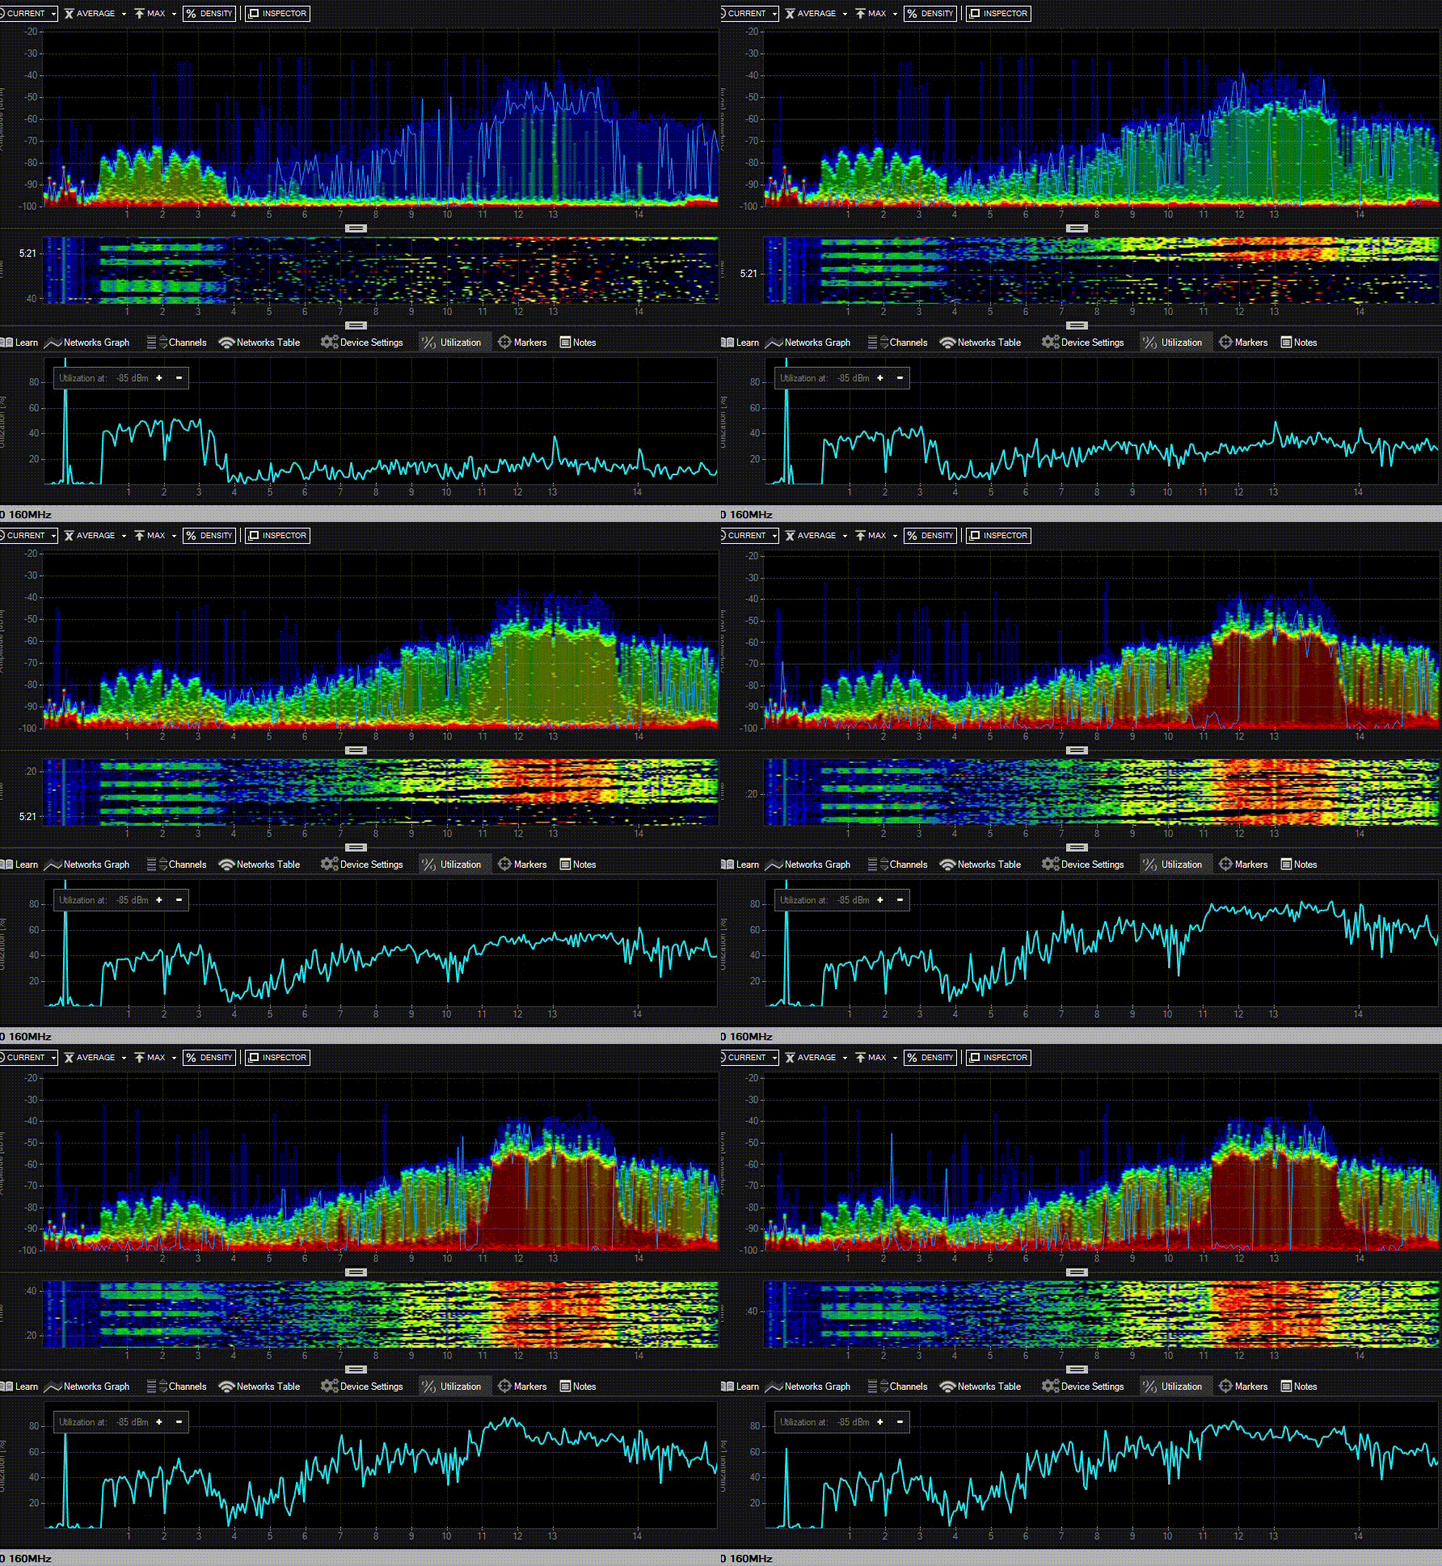
We can see
- the utilization threshold set at -85 dBm
- the light blue utilization graph rising from a baseline of 20 to 80%
- the waterfall graph is a rainbow of red and green because the spectrum is very crowded with other access point in other apartments + wireless repeaters
- in the far left is visible the signal from my volumetric sensor ❗ and an intermittent transmission occurring on channel 1, 2 and 3 ❗
To understand better how other types of data flows are graphically represented, I started two captures on a streaming service and a buffered audio/video service like YouTube:
The capture of a streaming service data flow
The capture of a YouTube data flow
Why I need to be careful with 40 MHz, 80 or 160 MHz
The same question can be formulated as: during the troubleshooting phase or the design phase of a wireless network, do we need to take into consideration the channel overlap (both co-channel interference and adjacent channel interference)? If high-demand applications are in use, the answer is yes 90% of the time because the wireless protocol is a “polite” and “listen before you talk” protocol. As soon as there is channel overlap (>30-40% of cell overlap), data corruption and collisions start to occur, clients downgrade their data rates which leads to a drop in performance and packet loss.
Moving more data with every transmission is not better if I have to wait 3 times as long to send a single packet - the result could be worse than sending what I have more frequently, in smaller bits. Not all applications actually benefit from bonded channels; Voice for instance relies on small packets that are time sensitive (jitter). Video however benefits greatly - but still has a sensitivity to Jitter in some cases (real time video). 6
And the remaining 10%? The impact of channel overlap is not a 0 or 1 thing because co-channel interference is strictly inevitable and problems can be highly correlated with the application resilience or the type of client, more precisely, its roaming algorithm or Keith Parsons’s green diamond; for example we can have different performance with the same application on a client which roams using RSSI only versus more advanced roaming algorithms that include SNR in the roam evaluation. Therefore, an application can also work fine with overlapping channels. Channel overlap is acceptable, and it even helps clients do better roaming from one Wi-Fi cell to another, but only within a certain percentage that each vendor specifies in its design guide based on the applications that need to connect to Wi-Fi.
Now, knowing that co-channel and adjacent channel interference are important variables, we can go back to the title paragraph and reflect on how wide channels can be disruptive in a wireless network, starting from these images:
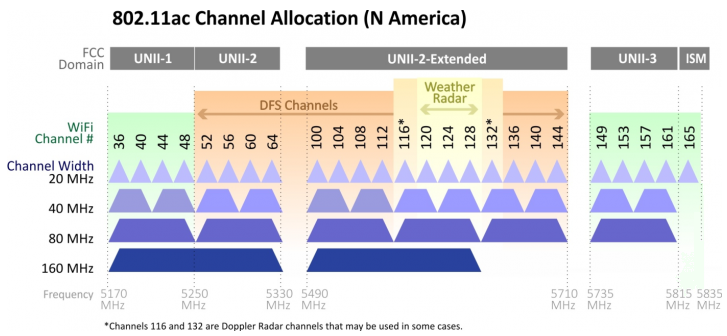
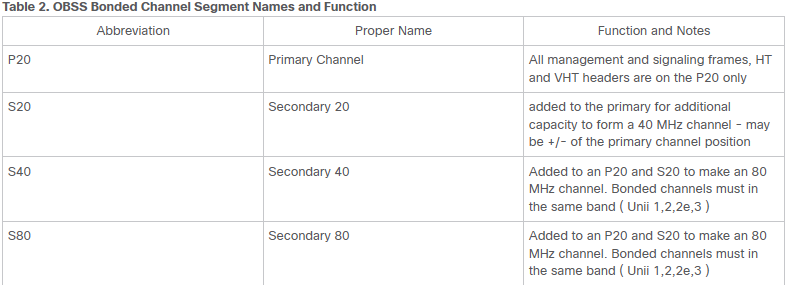
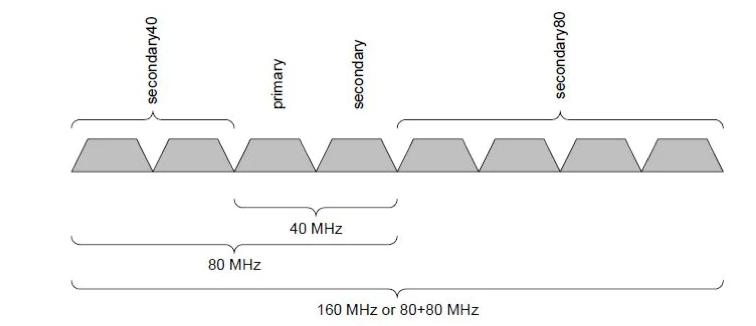
So if we double the channel bandwidth, we double the data throughput but we drastically reduce the number of channels available risking “friendly fire” interference that is proportionally dangerous to the number of access points in the same area.
Channel assignment algorithms: Cisco DCA
In these 3-4 years I worked both with Cisco AireOS and IOS-XE controllers, so I chose to study and review Cisco’s proprietary DCA algorithm which is only a piece of a bigger cake called RRM or Radio Resource Management that includes:
- Radio resource monitoring
- Power control transmission
- Dynamic channel assignment
- Coverage hole detection and correction
- RF grouping
All the information under this paragraph are from the Cisco 9800 configuration guide, release 17.6 and 2021 Radio Resource Management white paper.
The main goal of the DCA algorithms is to automate the bandwidth and channel assignment, making (hopefully) quick and accurate RF predictions using real-time characteristics like:
- RSSI between neighboring access points, which is a tricky variable in an environment with very high shelves because the signal propagation is irregular from top to bottom, giving the false impression that two APs hear each other very well when on the floor the coverage is different.
- Noise. We already covered this variable and its effects on wireless performance with topics like CCI.
- 802.11 interference. Same as the noise.
- Load and utilization, this setting is disabled by default but why? In my opinion, load is a “grey” variable that should be treated with caution in DCA calculations because steering a client towards less-occupied access points is not always effective.
DCA makes its decision by merging all these values into a metric called CM (cost metric) expressed in dB like, as stated in the white paper, a weighted SNIR where -80 dB is better than -60 dB like a noise floor value. I discovered that SNIR, or the signal-to-noise-plus-interference ratio, is a more complicated value than SNR because it includes both noise and the sum of all interfering signals in the equation. To clarify even more, I leave here the bulky Wikipedia definition:
In information theory and telecommunication engineering, the signal-to-interference-plus-noise ratio (SINR) (also known as the signal-to-noise-plus-interference ratio (SNIR)) is a quantity used to give theoretical upper bounds on channel capacity (or the rate of information transfer) in wireless communication systems such as networks. Analogous to the signal-to-noise ratio (SNR) used often in wired communications systems, the SINR is defined as the power of a certain signal of interest divided by the sum of the interference power (from all the other interfering signals) and the power of some background noise. If the power of noise term is zero, then the SINR reduces to the signal-to-interference ratio (SIR). Conversely, zero interference reduces the SINR to the SNR, which is used less often when developing mathematical models of wireless networks such as cellular networks.
After this initial definition, the Wikipedia article continues as follow
The complexity and randomness of certain types of wireless networks and signal propagation has motivated the use of stochastic geometry models in order to model the SINR, particularly for cellular or mobile phone networks.
Which is in a way fascinating and maybe I will cover it in another article. But let’s go back to the Cisco DCA and how it works.
The variables in play are clear, but how does the wireless LAN controller makes DCA decision? The WLC collects in a list (CPCI or Channel Plan Change Initiator list) the CM statistics of all access points in a RF group, starting from the one with the worst performance and linking together values from the first and second hop neighbors. CM values from the 2nd hop neighbor are useful because we want to change a channel dynamically only if there are good conditions in the neighboring channels, avoiding a worthless chain reaction of channel changes across the entire RF group.
The channel switch can be tuned manually with DCA sensitivity thresholds:
- AireOS 8.10
Band GHz High Δ(CM) Medium Δ(CM) Low Δ(CM) 2.4 5 dB 10 dB 20 dB 5 5 dB 15 dB 20 dB
IOS XE 17.3 7
- Low: The DCA algorithm is not particularly sensitive to environmental changes. The DCA threshold is 30 dB.
- Medium: (default) The DCA algorithm is moderately sensitive to environmental changes. The DCA threshold is 15 dB.
- High: The DCA algorithm is highly sensitive to environmental changes. The DCA threshold is 5 dB.
For example (not a real scenario):
- the DCA start on a 5 GHz AP 1 with the worst Cost Metric (CM) of -65 dB on channel 36. AP 2 is on channel 40. AP 3 is on channel 44.
- the DCA sensitivity threshold is set to Low
- it discover only two aps with better CM
- AP 2 CM: -67 dB -> ΔCM = 2 dB
- AP 3 CM: -79 dB -> ΔCM = 14 dB
- The ΔCM of ch 44 being lower of the low threshold (20 dB for 5 GHz) it will not recommended the channel change to 44. Same for the AP 2.
- If we had used the high threshold (5 dB for 5 GHz), we would have had a possible candidate for a channel change.
All the steps above are done on each access point in the RF group, making a list of all “possible improvements” or the Channel Plan Change Initiator list (CPCI). The changes are not instantly committed because we don’t want the chain of channel changes to negatively impact the RF group; therefore, the NCCF function (normalized cumulative cost function) rates the change for the entire group before switching channels.
Think of NCCF as an overall “goodness” rating of the change for the group.
Wrapping up, writing this paragraph on the DCA helped me understand the core concepts of this algorithm. But the documentation also covers:
- how DCA handles overlapped bonded channels
- modes of operation (scheduled and start-up mode)
- Dynamic Bandwidth Selection or DBS
- Persistent Device Avoidance
- Event Driven RRM
References
- Keith Parsons’ work on multiple Youtube videos and articles on Wireless professionals website and on Ekahau youtube channel
- Matt Starling and Mac Deryng work on WifiNinjas blog
- 802.11 Wireless Networks by Matthew Gast (Amazon link)
- Wikipedia Physical Layer: Services
- Aruba Push It To The Limit! Understand Wi-Fi’s Breaking Point to Design Better WLANs
- Jeremy Sharp’s blog post on Spectrum Analysis – PHYs and Interferers
- Aruba How do we handle Channel Busy on RF and the factors that could contribute?
- CCIE Rasika Nayanajith’s blog AireOS DCA Dynamic Channel Assignment
- Wi-Fi Airtime Utilization
- Aruba Mama Says Channel Bonding is the Devil by Nick Shoemaker
- Cisco 9800 configuration guide, release 17.6
- Cisco 2021 Radio Resource Management white paper
Links
-
This random oscilloscopes company guide on Wi-Fi: Overview of the 802.11 Physical Layer and Transmitter Measurements ↩︎
-
2018 Wi-Fi Trek - Joel Crane - Untangling Utilization, Airtime, and Duty Cycle ↩︎
-
Use Channel Utilization in Wi-Fi Ben Miller WLPC Phoenix 2019 ↩︎
-
Ekahau - Demystifying Wi-Fi: Channel Planning Made Simple ↩︎
-
5500 Series Wireless Controllers Radio Resource Management White Paper ↩︎
-
Configuring Advanced 802.11 Channel Assignment Parameters ↩︎
